





Panels and Reports

Complete, real-time visibility into your operations

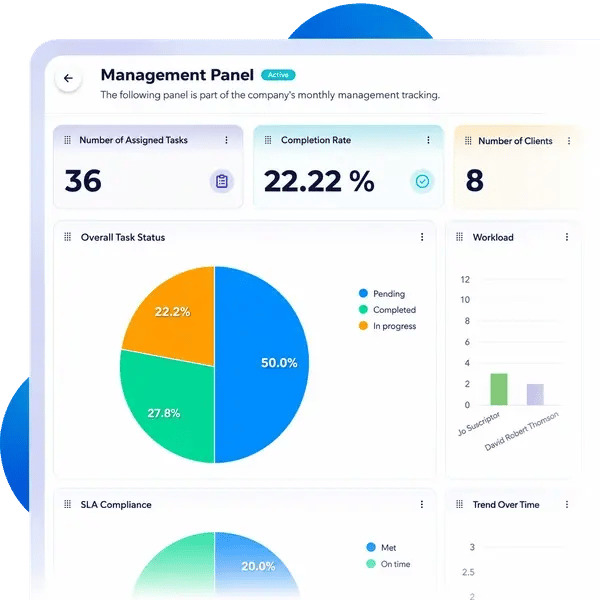
View the status of your tasks, execution times, and the workload for each team on customizable dashboards, with ready-to-use reports that update automatically.

CheckOP management panel showing overall task status, workload and SLA compliance

Companies That Trust CheckOP

  • progresus-assent-logo
  • logo-lavanti-assent
  • AMC Logo

The Real Problem

You have the data, but it's coming in late and in Excel

Your transaction data gets bogged down in spreadsheets and manual reports. By the time it’s finally consolidated, the window of opportunity has already passed.

70%

Much of the reporting time is spent consolidating data manually, rather than analyzing it.

Manual reports that take hours each week.

No visibility into the actual status of tasks and teams.

Decisions that are made too late, when the problem has already escalated.

Each area is a different size.

bg-waves-1
Your Solution

A control panel for your entire field operation

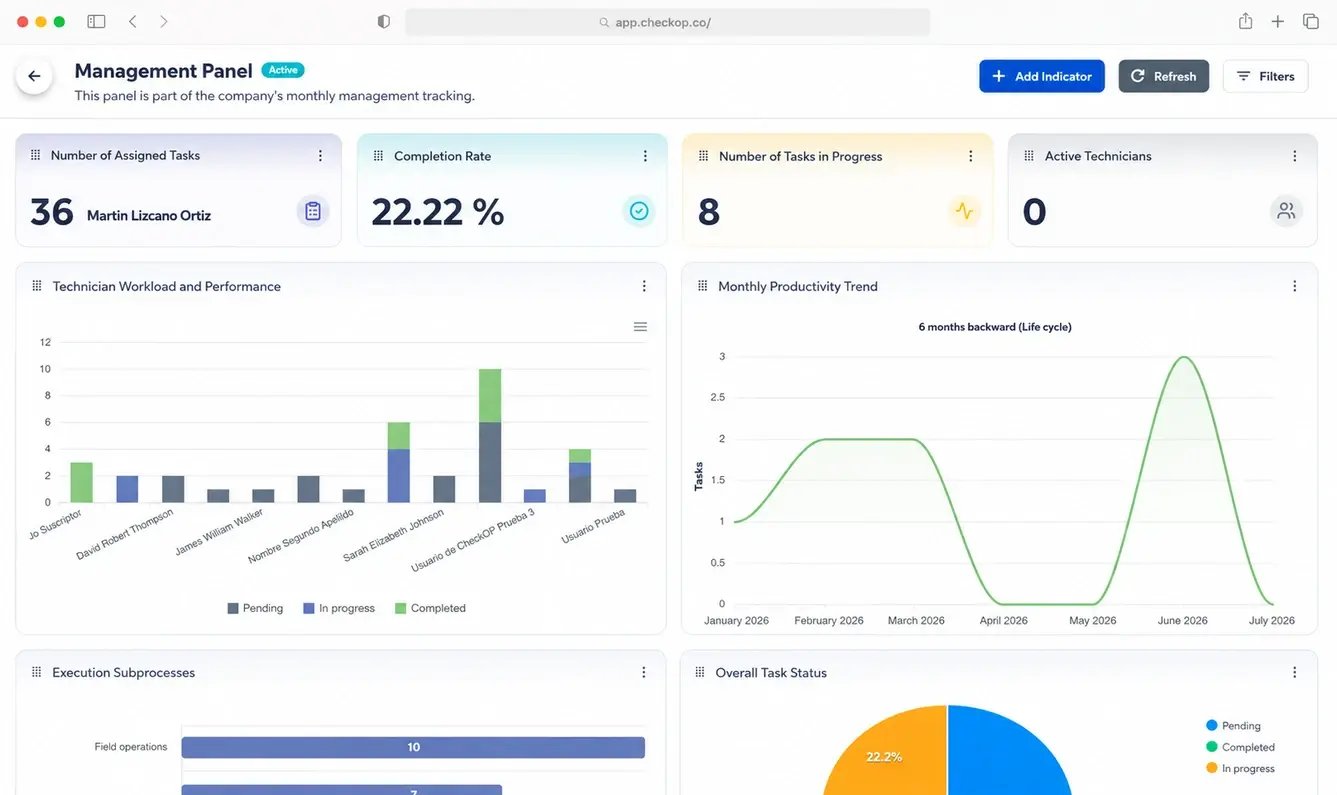
Replace manual spreadsheets with a dashboard that consolidates tasks, times, and equipment in real time, ready for same-day decision-making.
Full CheckOP management panel showing assigned tasks, completion rate and productivity trends

Do you need panels tailored to your operation?

We'll work with you to determine which metrics, roles, and permissions your operation needs, and then send you a customized proposal.

Your Solution

Ready-to-use reports—no setup required

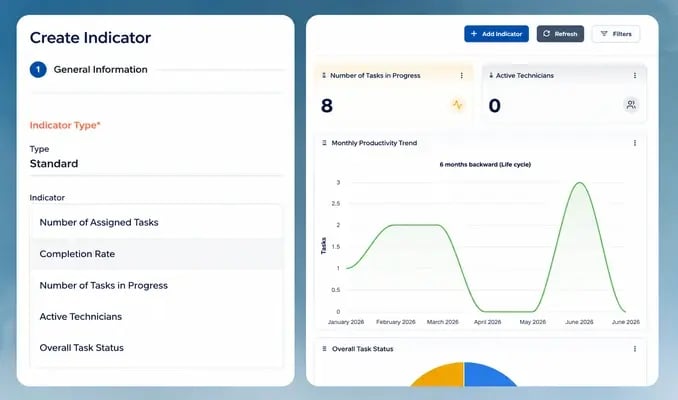
With just one click, add the reports your operation already uses: overall task status, average completion time per advisor, and scheduled tasks by process or service. Each report comes with its recommended chart and is automatically populated with your data.

CheckOP wizard for selecting standard indicators with a live management panel preview
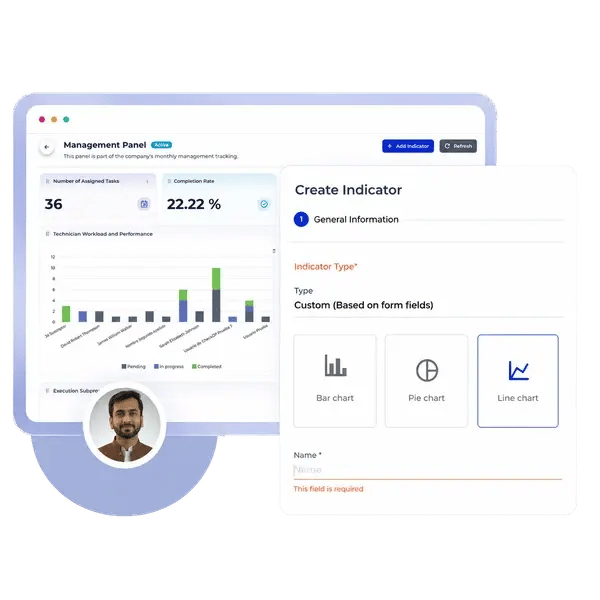
CheckOP management panel interface showing the wizard to create a custom indicator
Your Solution

Create your own report in five steps

A guided wizard takes you from the data source to the final chart: you choose what to measure (count, sum, or average), how to group it, and which visualization to use. Then you apply global filters by date, advisor, process, or form, and all the reports on the dashboard update instantly.

How Your Tasks Become a Live Dashboard

CheckOP offers a wide range of features to enhance your operations.

Field capture

Each task stores its responses, times, and status at the time it is executed.

Real-Time Dashboard

CheckOP automatically aggregates and charts that data, without having to export or cross-reference spreadsheets.

Shared decision-making

You share the dashboard with permissions based on user or profile, and each role sees exactly what it's supposed to.

Success Story

A single view of the entire field operation

We centralize technical operations in the industrial sector.

real-time-data-monitoring-control-room
  • Monitored Tasks

    +0/month
  • Recovered per week in reports

    0Hrs

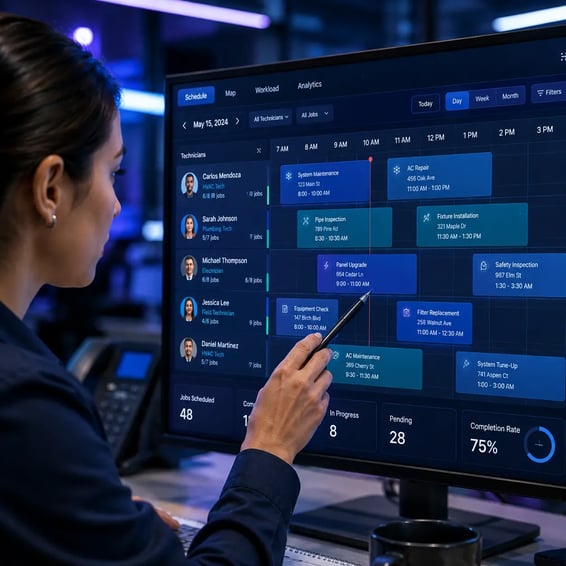
Scheduling and Control of Field Operations

A service team replaced its Excel reports with a single dashboard that consolidates task status, time spent per advisor, and workload by process. Now the manager reviews operations in real time and makes decisions the same day, without waiting for the end-of-month consolidated report.

View Success Story

For large teams or specific needs

Find the answers you need

There's no set limit: create as many dashboards as you need and add as many predefined or custom reports as your processes require.

Yes. They are fed by the tasks in your operation and are updated in real time. The global filters on the dashboard apply instantly to all compatible reports.

Yes. Each panel has visibility levels (private, team, shared, and organization) and permissions to view, edit, or manage, which can be assigned by user or by profile.

Yes. A five-step wizard lets you choose the metric, dimensions, and chart type for your tasks and forms.

Yes. You can download the image or data from each report to share or analyze them outside the platform.