1:42
Picture this: you're in charge of a field team and need to check how the operation is going. You open the reports panel and find the same charts as always, the same ones the client team sees, the same ones the operations person sees. None of them show you what actually matters to you, and there's no way to change that.
That scenario is no longer necessary. CheckOP's Panels and Reports module has been completely redesigned.
The benefit
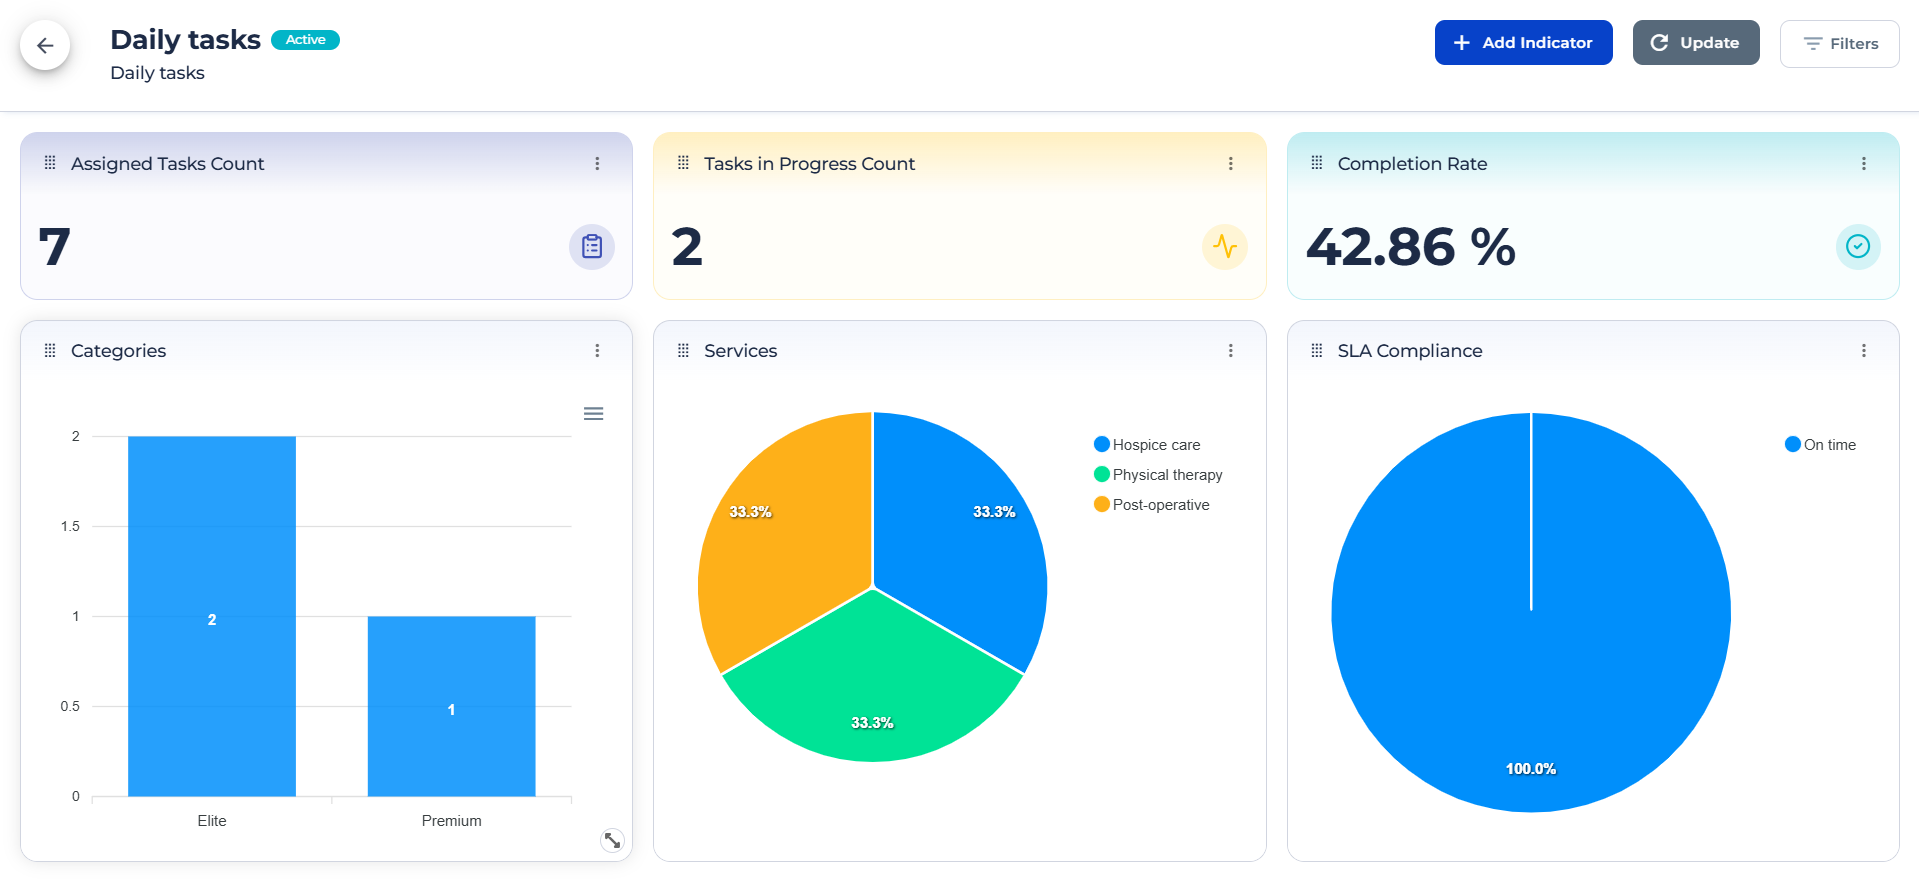
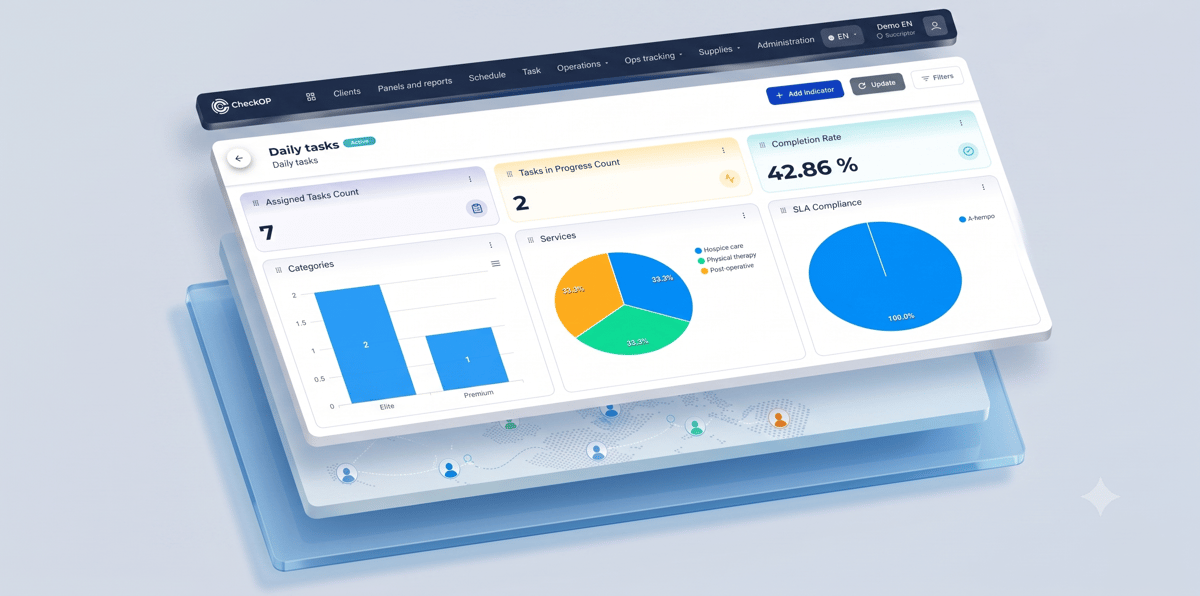
Before, there was a single, fixed panel with preset charts, the same for every user. Now each team or each manager can have their own panel, with the information they actually need to monitor, and share it only with the right people. That means faster decisions, fewer hand-built reports, and a data view that reflects your real operation, not a generic template.
How it works?
Multiple panels, not just one: You can now create as many panels as you need, each focused on a different purpose: task tracking, client indicators, team performance, and more.
Share with specific users: Each panel can be shared only with the people or teams who need to see it. Sensitive or specialized information is no longer exposed to every user by default.
Custom layout: How the charts are arranged within each panel is also up to you: you can organize them in the order and priority that makes sense for your team.
Preset and custom chart: The predefined chart options are still available, but now you can also create custom indicator charts, built from the information in your own forms. Since those forms are configured to fit your operation, the indicators you build reflect exactly the data that matters to you, not a generic average.